
Overview
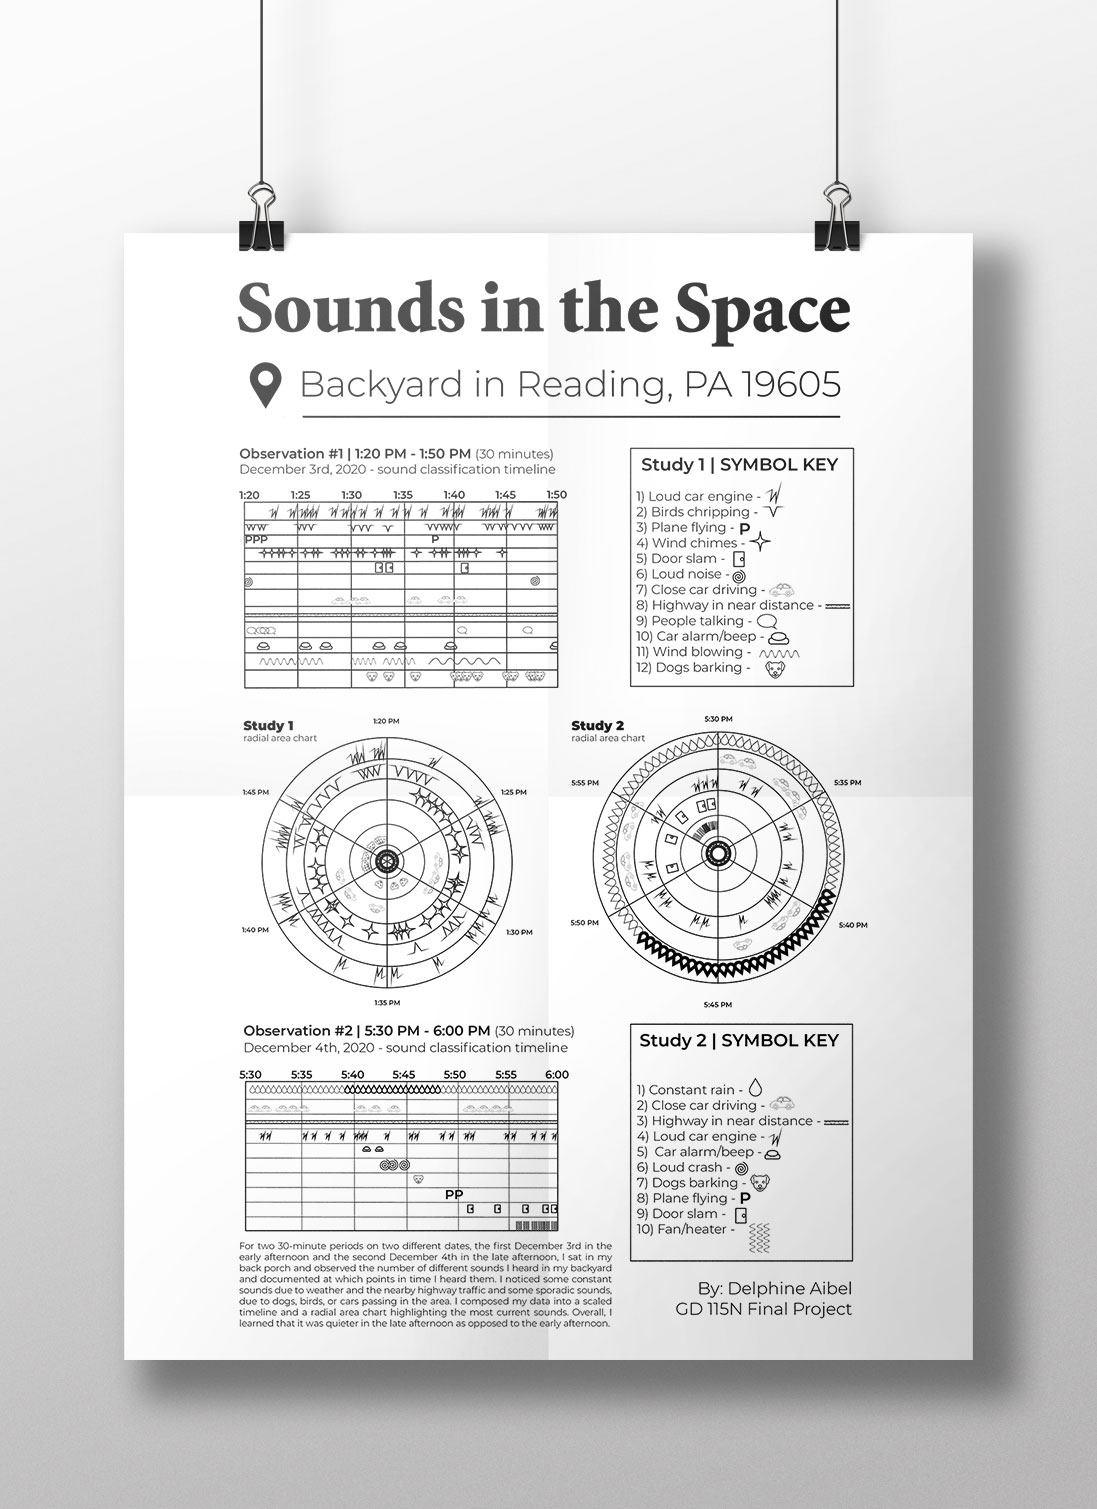
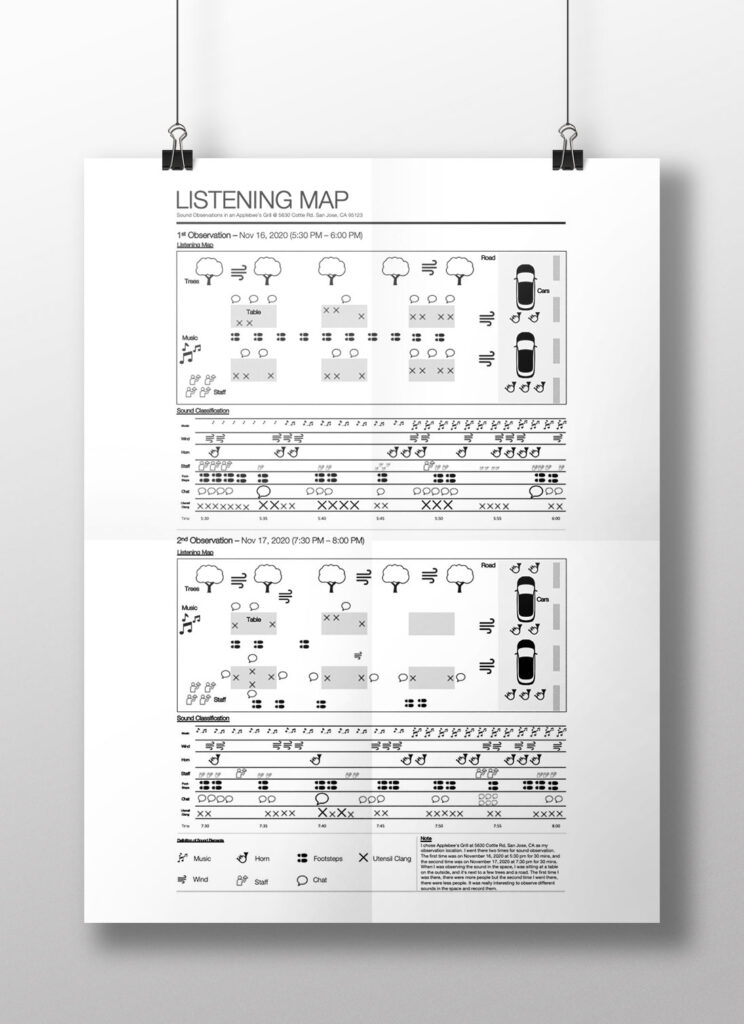
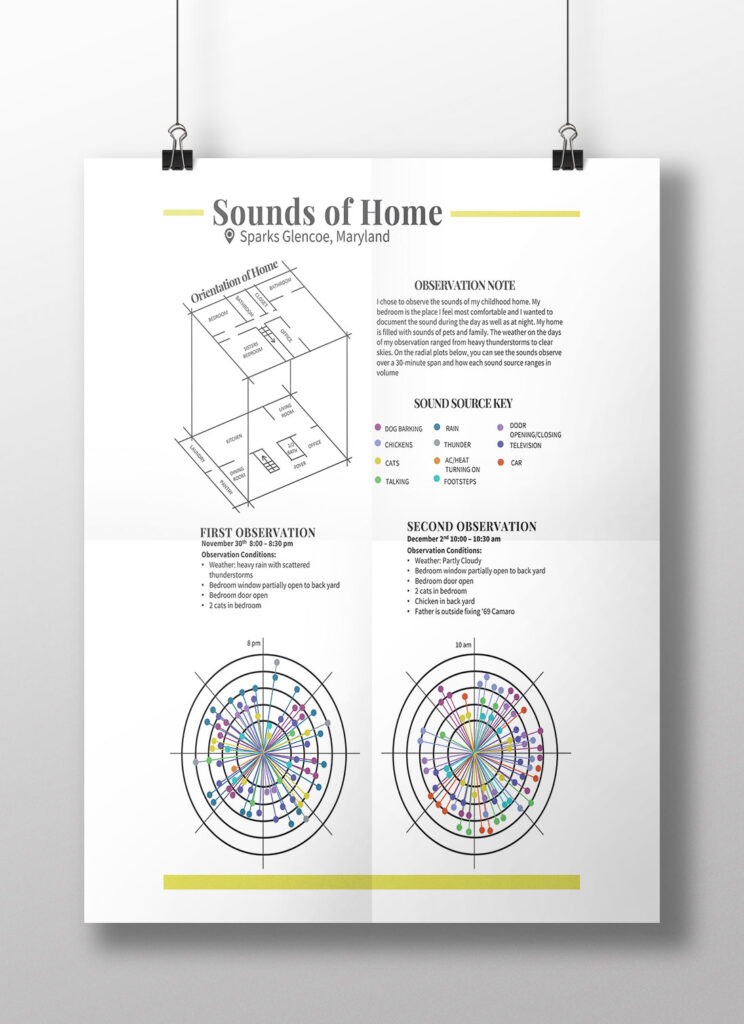
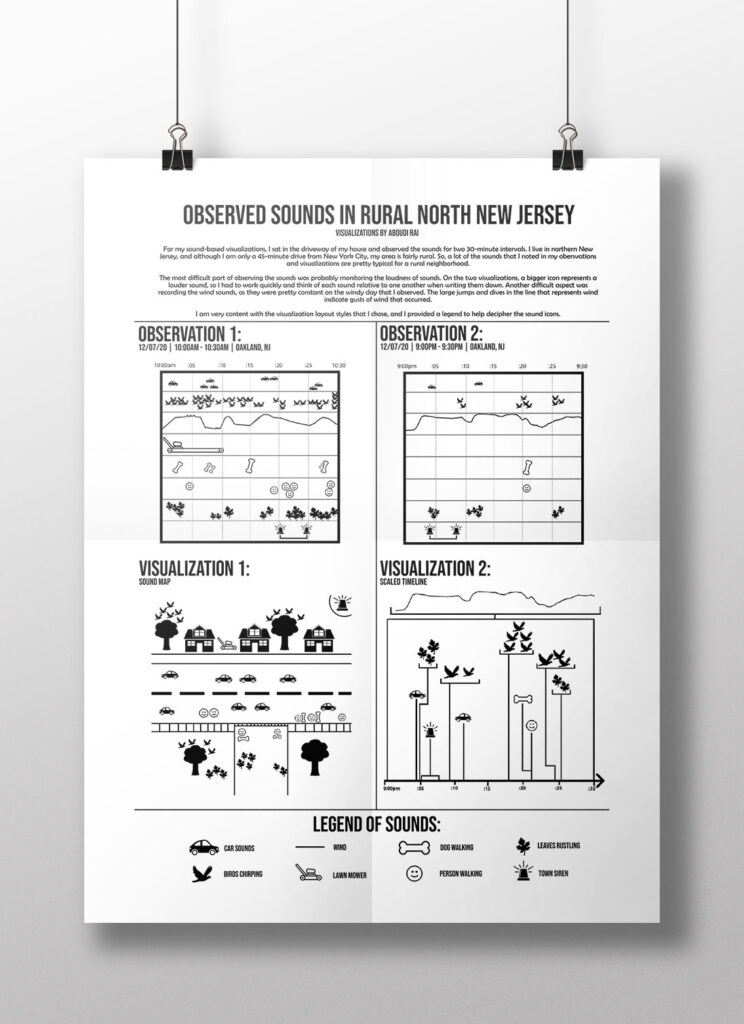
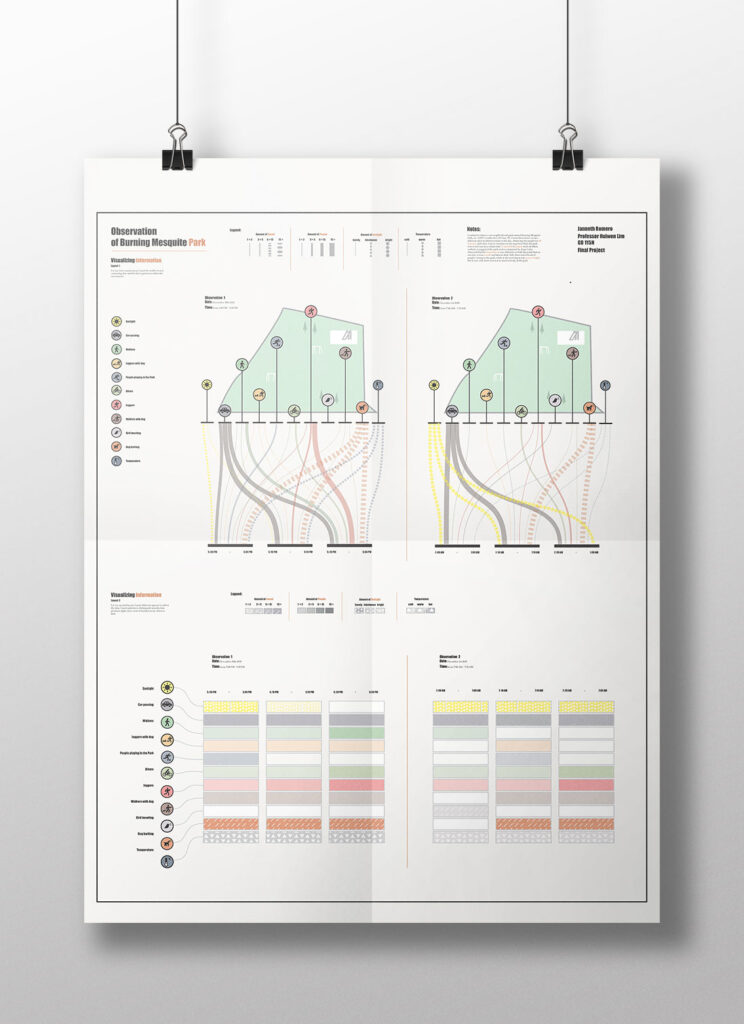
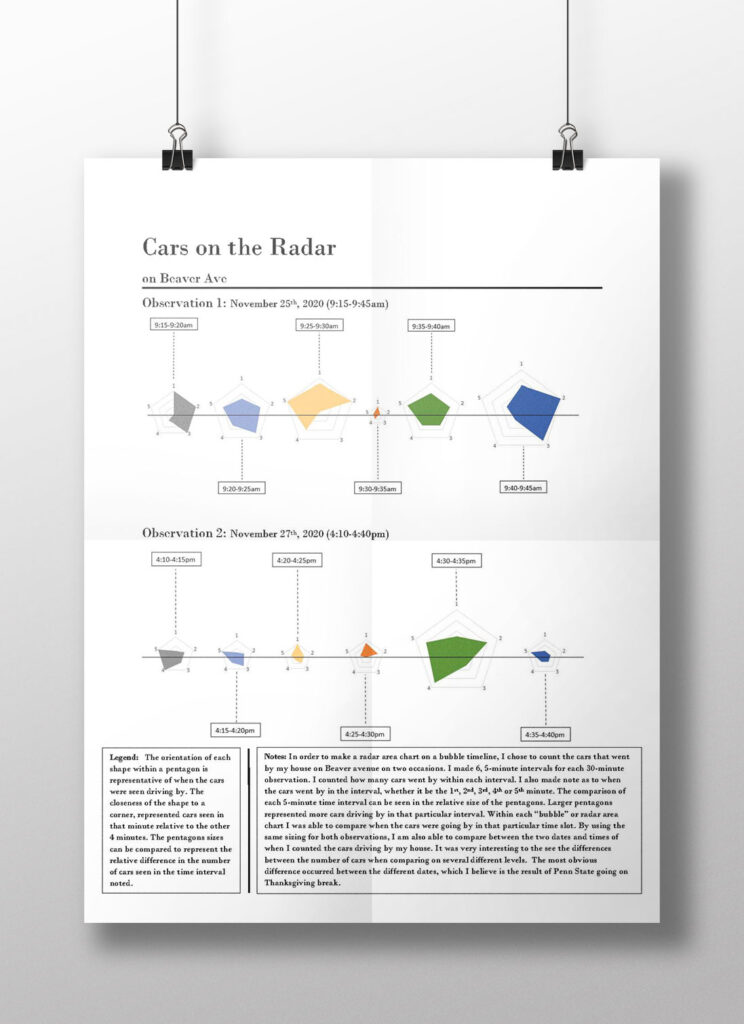
Select a place for two 30 mins observations, and then you are going to observe something there such as sounds, human behavior, traffics, etc. As a research method, you must take a note or a sketch, recording sounds, or video shooting. It would be the raw data for visualization that you must analyze later. You have to observe twice at the same place but at different dates or times for comparison.
You’ve learned about how to visualize the different information through the lectures as well as case studies. Based on your new knowledge of visualizing information, you are going to visualize the information that you observed. Visualize your observations in order to let your audience know about your discovery quickly and efficiently.
Spring 2020. GD115N Visualizing Information
Department of Graphic Design
Stuckeman School
College of Arts and Architecture
Penn State University


May 26, 2025
[…] rybelsus 3mg […]
June 2, 2025
[…] cost of clomid […]
July 10, 2025
[…] generic viagra 50mg […]
July 10, 2025
[…] sildenafil citrate tablets 50 mg […]
July 10, 2025
[…] cialis daily cost […]
July 10, 2025
[…] hims cialis […]
July 26, 2025
[…] Siberian vs Korean ginseng for men […]
August 19, 2025
[…] 60 mg cialis […]
August 19, 2025
[…] buy viagra 100 mg […]
August 19, 2025
[…] sildenafil 100 mg ebay […]
August 19, 2025
[…] street value viagra 100mg […]
August 19, 2025
[…] 50 mg of viagra […]